 cloud
cloud
 Nas
Nas
之前没有这方面的需求,而这次买的蜗牛主机,本身就是二手的,而且电源也感觉不靠谱。网上很多人就不断在说,有boom的可能。于是总是需要ssh进去top看一下,看得次数多了,就想有没有一个软件可以直接在网页上面进行监控呢,又不需要像omv那样功能那么多。查了一下,才发现,这里面原来是个大坑,这个功能是专业运维人员的必备技能,既有nagios和zabbix这样的基础设施般的软件,也有linux-dashboard、serverstatus这样的规模小点的项目,甚至小米都开源了自己的运维软件。本来想试一下nagios的,可是看了看安装配置,头有点大。查来查去,看到netdata这个很火的项目,星星好多。尽管配置也很麻烦,但一方面wiki也做得很好,另一方面我的需求很简单,毕竟只是监控自己的几台个人电脑,硬着头皮花了点时间折腾了一下,最终效果还不错。
安装
有几种安装方式,这里采用手动安装的方式。参考https://docs.netdata.cloud/packaging/installer/
sudo apt install zlib1g-dev uuid-dev libmnl-dev gcc make git autoconf autoconf-archive autogen automake pkg-config curl
git clone https://github.com/netdata/netdata.git --depth=100
cd netdata
sudo ./netdata-installer.sh
还有更简单的安装方式,不过毕竟手动安装更透明一点,安装之后会添加systemd任务。
基本配置
主要配置文件都在/etc/netdata/netdata.conf里面。如果安装完没有这个文件的话,用下面的命令生成:
sudo wget -O /etc/netdata/netdata.conf http://localhost:19999/netdata.conf
里面具体内容如下:
[global]
update every =2             #默认1秒,实测设成2秒的话cpu占用少一半吧。
[plugins]
# 下面这些为internal plugins,为netdata进程的线程。
# proc = yes
# diskspace = yes
# cgroups = yes
# tc = yes
# idlejitter = yes

# 下面这些为external plugins,体现为单独的进程,因为只需要基本的监控功能,所以把这些都关掉了。
enable running new plugins = no
# check for new plugins every = 60
go.d = no
charts.d = no
ioping = no
python.d = no
node.d = no
apps = no
fping = no

# 关闭提醒功能。
[health]
enabled =no
# 这个是实现监控所有的主机。
[registry]
enabled = yes/no          #在registry机器上设为yes,其他机器上设为no。
registry to announce = http://ip:19999
还有默认会匿名收集信息,毕竟人家提供了这么好的软件,无可厚非。如果要取消匿名统计的话,在 /etc/netdata 下新建opt-out-from-anonymous-statistics文件就可以了。
自定义dashboard
自带的监控页面只能监控一台主机,而且监控的信息太多,大多数都是不会看的。而netdata提供了自定义dashboard的功能,新建
/usr/share/netdata/web/custom.html ,访问
http://ip:19999/custom.html 就可以了。
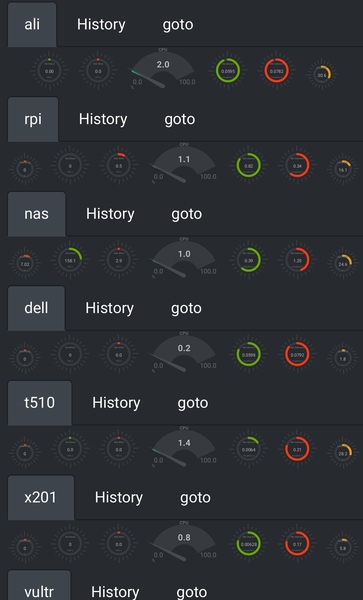
<!DOCTYPE html>
<!-- SPDX-License-Identifier: GPL-3.0-or-later -->
<html lang="en">
<head>
<title>NetData Dashboard</title>
<meta name="application-name" content="netdata">

<meta http-equiv="Content-Type" content="text/html; charset=utf-8" />
<meta charset="utf-8">
<meta http-equiv="X-UA-Compatible" content="IE=edge,chrome=1">
<meta name="viewport" content="width=device-width, initial-scale=1">
<meta name="apple-mobile-web-app-capable" content="yes">
<meta name="apple-mobile-web-app-status-bar-style" content="black-translucent">
<meta name="author" content="costa@tsaousis.gr">

<meta property="og:locale" content="en_US" />
<meta property="og:image" content="https://cloud.githubusercontent.com/assets/2662304/22945737/e98cd0c6-f2fd-11e6-96f1-5501934b0955.png"/>
<meta property="og:url" content="http://my-netdata.io/"/>
<meta property="og:type" content="website"/>
<meta property="og:site_name" content="netdata"/>
<meta property="og:title" content="netdata - real-time performance monitoring, done right!"/>
<meta property="og:description" content="Stunning real-time dashboards, blazingly fast and extremely interactive. Zero configuration, zero dependencies, zero maintenance." />
</head>
<script>var netdataTheme = 'slate';</script>
<script type="text/javascript" src="dashboard.js?v20170724-1"></script>
<body>

<div class="container" style="width: 100%; padding-top: 10px; text-align: center; color: #AAA">


<!-- * xxx -->
<!-- Nav tabs -->
<ul class="nav nav-tabs" role="tablist">
<li role="presentation" class="active"><a href="#gauge_xxx" aria-controls="gauge" role="tab" data-toggle="tab">xxx</a></li>
<li role="presentation"><a href="#easypiechart_xxx" aria-controls="easypiechart" role="tab" data-toggle="tab">History</a></li>
<li role="presentation"><a href="http://ip:19999">goto</a></li>
</ul>
<!-- Tab panes -->
<div class="tab-content">
<div role="tabpanel" class="tab-pane active" id="gauge_xxx">
<div class="netdata-container" style="margin-right: 5px;" data-netdata="system.swap"
data-host="http://ip:19999"
data-dimensions="used"
data-append-options="percentage"
data-chart-library="easypiechart"
data-title="Used Swap"
data-units="%"
data-easypiechart-max-value="100"
data-width="9%"
data-before="0"
data-after="-600"
data-points="600"
data-colors="#DD4400"
role="application"></div>

<div class="netdata-container" style="margin-right: 5px;" data-netdata="system.io"
data-host="http://ip:19999"
data-dimensions="in"
data-chart-library="easypiechart"
data-title="Disk Read"
data-width="11%"
data-before="0"
data-after="-600"
data-points="600"
data-common-units="system.io.mainhead"
role="application"></div>

<div class="netdata-container" style="margin-right: 5px;" data-netdata="system.io"
data-host="http://ip:19999"
data-dimensions="out"
data-chart-library="easypiechart"
data-title="Disk Write"
data-width="11%"
data-before="0"
data-after="-600"
data-points="600"
data-common-units="system.io.mainhead"
role="application"></div>

<div class="netdata-container" style="margin-right: 5px;" data-netdata="system.cpu"
data-host="http://ip:19999"
data-chart-library="gauge"
data-title="CPU"
data-units="%"
data-gauge-max-value="100"
data-width="20%"
data-after="-600"
data-points="600"
data-colors="#22AA99"
role="application"></div>

<div class="netdata-container" style="margin-right: 5px;" data-netdata="system.net"
data-host="http://ip:19999"
data-dimensions="received"
data-chart-library="easypiechart"
data-title="Net Inbound"
data-width="11%"
data-before="0"
data-after="-600"
data-points="600"
data-common-units="system.net.mainhead"
role="application"></div>

<div class="netdata-container" style="margin-right: 5px;" data-netdata="system.net"
data-host="http://ip:19999"
data-dimensions="sent"
data-chart-library="easypiechart"
data-title="Net Outbound"
data-width="11%"
data-before="0"
data-after="-600"
data-points="600"
data-common-units="system.net.mainhead"
role="application"></div>

<div class="netdata-container" style="margin-right: 5px;" data-netdata="system.ram"
data-host="http://ip:19999"
data-dimensions="used|buffers|active|wired" // active and wired are FreeBSD stats
data-append-options="percentage"
data-chart-library="easypiechart"
data-title="Used RAM"
data-units="%"
data-easypiechart-max-value="100"
data-width="9%"
data-after="-600"
data-points="600"
data-colors="#EE9911"
role="application"></div>
</div>
<div role="tabpanel" class="tab-pane" id="easypiechart_xxx">

<div data-netdata="system.cpu"
data-host="http://ip:19999"
data-title="CPU"
data-chart-library="dygraph"
data-width="100%"
data-after="-300"
data-dygraph-valuerange="[0, 100]"
></div>
<div data-netdata="system.io"
data-host="http://ip:19999"
data-title="Disk"
data-common-max="io"
data-common-min="io"
data-chart-library="dygraph"
data-width="100%"
data-after="-300"
></div>
<div data-netdata="system.net"
data-host="http://ip:19999"
data-common-max="traffic"
data-common-min="traffic"
data-title="Network"
data-chart-library="dygraph"
data-width="100%"
data-after="-300"
></div>
<div data-netdata="system.ram"
data-host="http://ip:19999"
data-common-max="ram"
data-common-min="ram"
data-title="RAM"
data-chart-library="dygraph"
data-width="100%"
data-after="-300"
></div>
</div>
</div>
</div>
</body>
</html>
上面的dashboard实现起来的话,大概是这样子的。
这里不知道怎么在markdown里面调整图片大小,试了几种方法都不行,要是org-mode能写这个就好了。
内网主机
对于内网主机,不希望将端口暴露在外网中。可通过master/slaves模式实现,slaves将数据streaming到master:
通过 http://master-host:master-port/host/slave-host/ 查看slave数据。首先生成stream.conf文件:
sudo /etc/netdata/edit-config stream.conf
然后配置master和slaves:
- master /etc/netdata/stream.conf
[11111111-2222-3333-4444-555555555555]
# enable/disable this API key
enabled = yes
# one hour of data for each of the slaves
default history = 3600
# do not save slave metrics on disk
default memory = ram
# alarms checks, only while the slave is connected
health enabled by default = auto
- slaves /etc/netdata/stream.conf
[stream]
# stream metrics to another netdata
enabled = yes
# the IP and PORT of the master
destination = 10.11.12.13:19999
# the API key to use
api key = 11111111-2222-3333-4444-555555555555